Price Fields & Fractal Swing Points
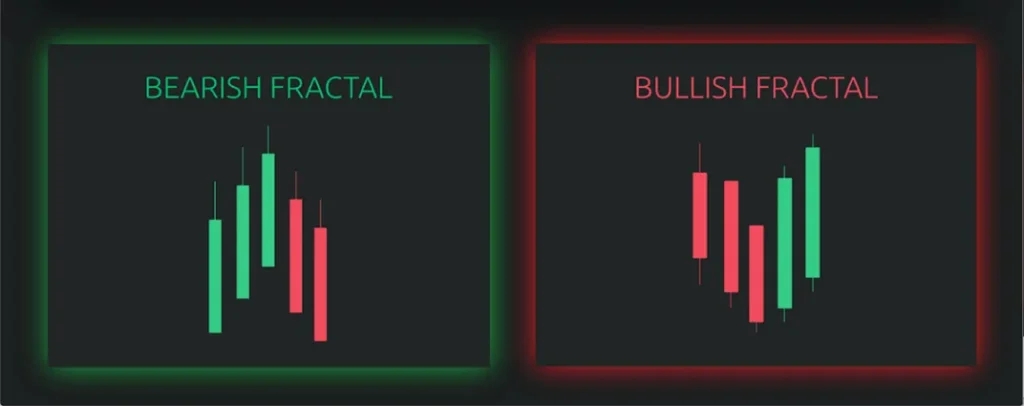
Push High (Bullish Fractal)
A classic bullish fractal forms when two lower candles appear on both the left and right sides, with a higher candle in the center.
This structure highlights a temporary pause before price continues pushing upward, often signaling strength in bullish momentum.
Slow Down (Bearish Fractal)
A bearish fractal is identified when two higher candles surround a lower middle candle.
This pattern reflects hesitation or exhaustion in upward movement and often precedes a pullback or reversal.
The Concept of Market Structure
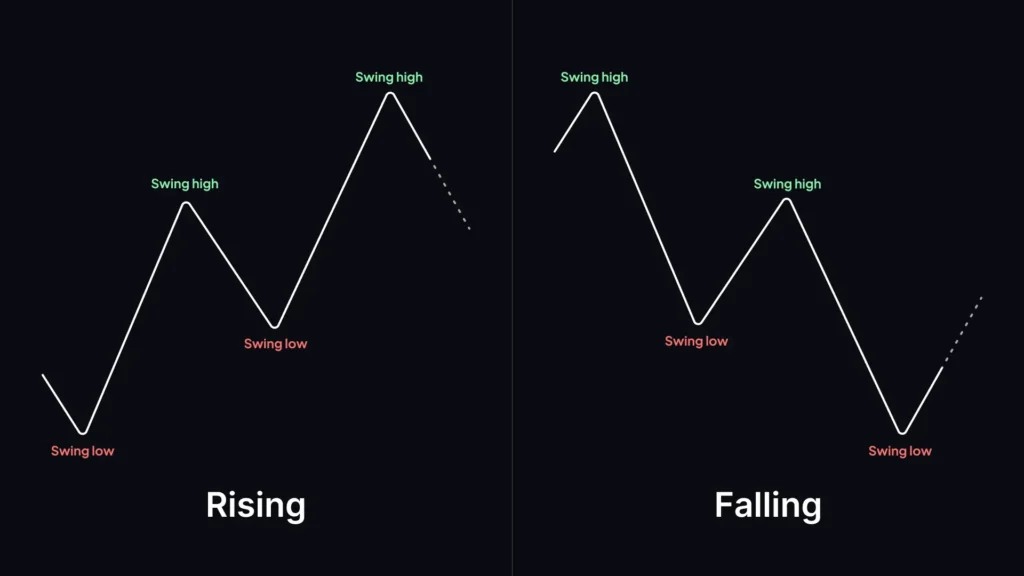
Markets move in a repeating rhythm that becomes easy to read once you understand how price naturally forms highs and lows.
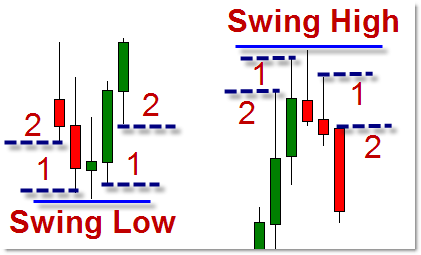
- Price action is built around swing highs and swing lows, which mark the true turning points of the market.
- Every move in price reacts to a previous swing, meaning each swing unfolds from a prior counter-swing.
- In a declining market, each new lower low is connected to a previous swing high or swing low.
- Typically, price moves from a Short-Term Low (STL) to a Short-Term High (STH) and repeats this process.
Understanding these swings is the foundation of mastering market structure.
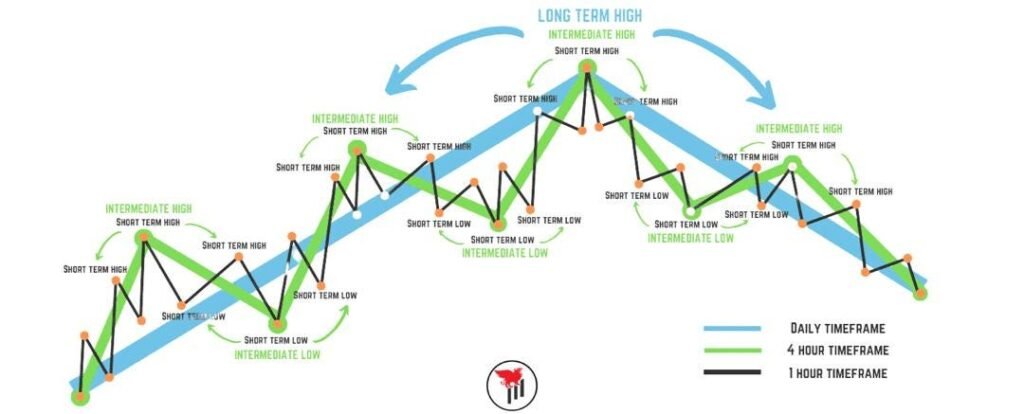
Short-, Intermediate-, and Long-Term Structure
As swing points develop, structure begins to form across different time horizons:
- An Intermediate-Term Low (ITL) forms when a short-term low has higher short-term lows on both sides.
- An intermediate-term high (ITH) forms when a short-term high has lower short-term highs on both sides.
Long-Term Market Structure
- A long-term low (LTL) forms when an intermediate-term low is supported by higher intermediate-term lows on both sides.
- A long-term high (LTH) forms when an intermediate-term high is surrounded by lower intermediate-term highs.
These levels often act as major turning points and long-term support or resistance zones.
Trader Support Using Market Structure
Market structure helps traders align entries with higher-probability zones:
- Focus primarily on lows across short-, intermediate-, and long-term structures.
- If you miss an entry near an LTL or ITL, buying near an STL can still offer strong upside potential.
- For sell setups, simply reverse the logic and focus on STH, ITH, and LTH.
- When price reaches a major support or resistance level and forms an ITL or ITH, expect a structure break and look for refined entries.
- Price often moves in equal legs—every swing tends to mirror a prior move.
- Example: If price rallies 50 pips after consolidation, expect the next pullback low to rise by roughly the same distance.
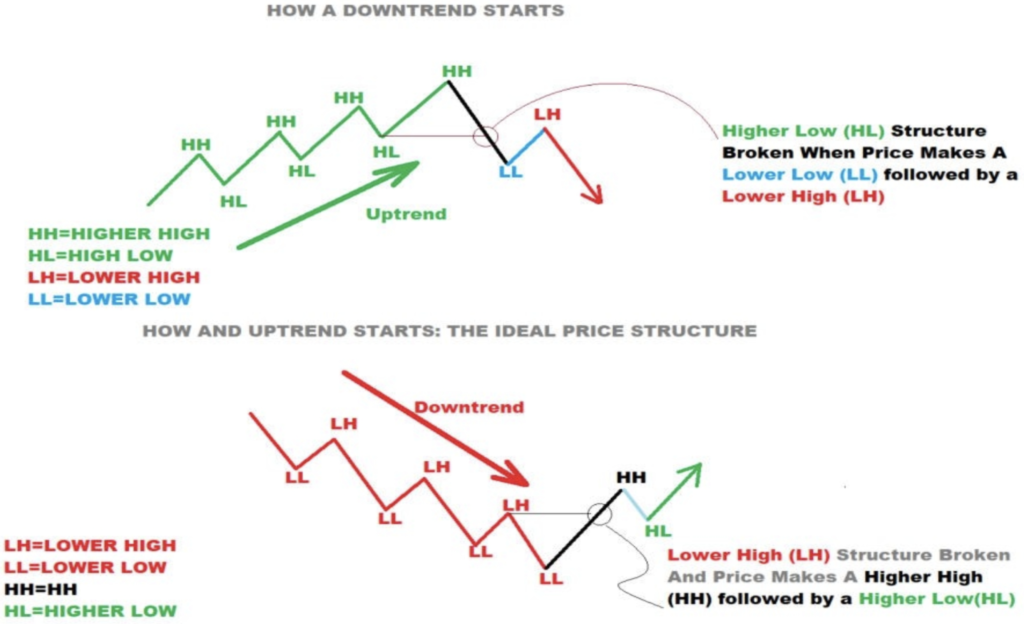
- In a bullish structure, price breaks previous highs while holding higher lows.
In a bearish structure, price breaks previous lows while maintaining lower highs.
Measuring the Midpoint of Swings
By summing two swing lows and dividing the result by 1.28 (rounded down), you can estimate the midpoint between them.
This midpoint often helps project the next swing high.
Monetary/Market Flow
Market flow focuses only on the most recent swing high and swing low—older swings are ignored.
- Market flow is strongest when daily, H4, and H1 timeframes align.
- Use the H4 chart as your primary guide for directional bias.
- If structure and flow are unclear, stay out of the market.
- Flow is bullish when the most recent swing high is broken and remains valid until the latest swing low breaks.
- Flow turns bearish when the most recent swing low breaks and holds until the swing high is taken.
- Market flow can change at any time, so prioritize higher-timeframe swings over short-term noise.
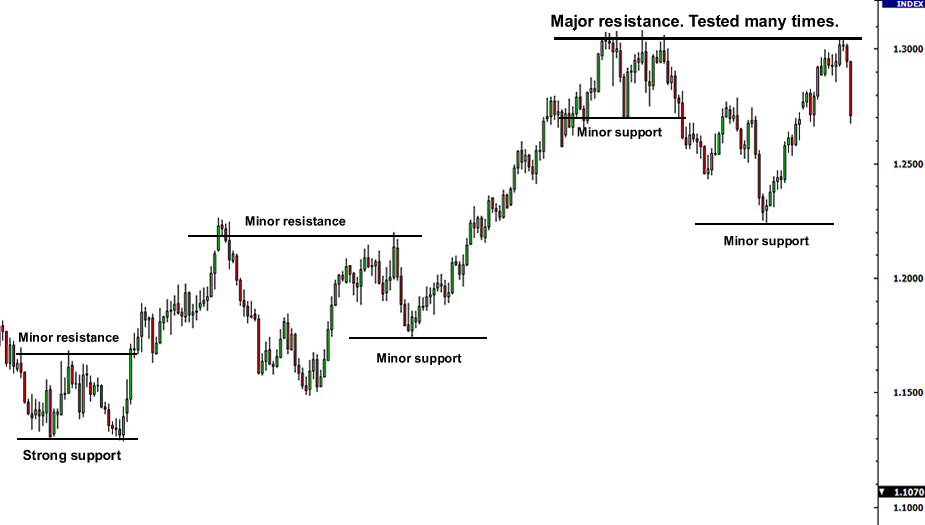
Support & Resistance in Trading
Support and resistance are powerful tools for anticipating price reactions:
- These levels often reflect supply and demand zones.
- Natural support and resistance can be drawn using the 12-month high and low range.
- Price reactions at these levels become especially powerful before the London or New York session opens, if other conditions align.
Session-Based Highs and Lows
- Asian Session
- Sets the range for London
- 12:00 AM – 9:00 AM GMT
- London Session
- Defines New York’s structure
- 8:00 AM – 12:00 PM GMT
- New York Session
- Establishes conditions for the next trading day
- 12:00 PM – 10:00 PM GMT
An hour before and after each session is acceptable for analysis.
Short-term intraday support and resistance come from intraday fractals, especially swings that revisit prior session highs or lows.
The 15-minute chart is ideal for tracking these levels.
Implied Support & Resistance (Fibonacci)
Fibonacci Retracements & Extensions
- Fibonacci retracement levels often act as dynamic support and resistance.
- These levels work well because many traders place entries and stops around them, creating a self-fulfilling effect.
- Fibonacci extensions are widely used for profit targets.
- Fibonacci tools are most effective in trending markets:
- Buy retracements at Fibonacci support in uptrends.
- Sell retracements at Fibonacci resistance in downtrends.
- Apply the tool using the most recent significant swing high and swing low.

Key Institutional & Psychological Levels
Additional high-impact levels include:
- Weekly open and close
- Previous day open and close
- Daily ADR high and low
- Institutional Pricing Levels (IPL)
Psychological price levels:
- Big Figure: 100-pip levels (e.g., 1.6000)
- Mid Figure: 50-pip levels (e.g., 1.5950)
- Key zones often form between these levels, such as 1.5980 or 1.5920
Traders typically focus on:
- 00 levels
- 80%, 50%, and 20% zones
These areas frequently attract institutional interest and sharp price reactions.
Trade With The Best Broker
if you want a broker that’s built for speed, stability, convenience with solid global licensing across multiple jurisdictions with reliable support, fast trade execution, speedy withdrawals, Exness is the best option to consider.